
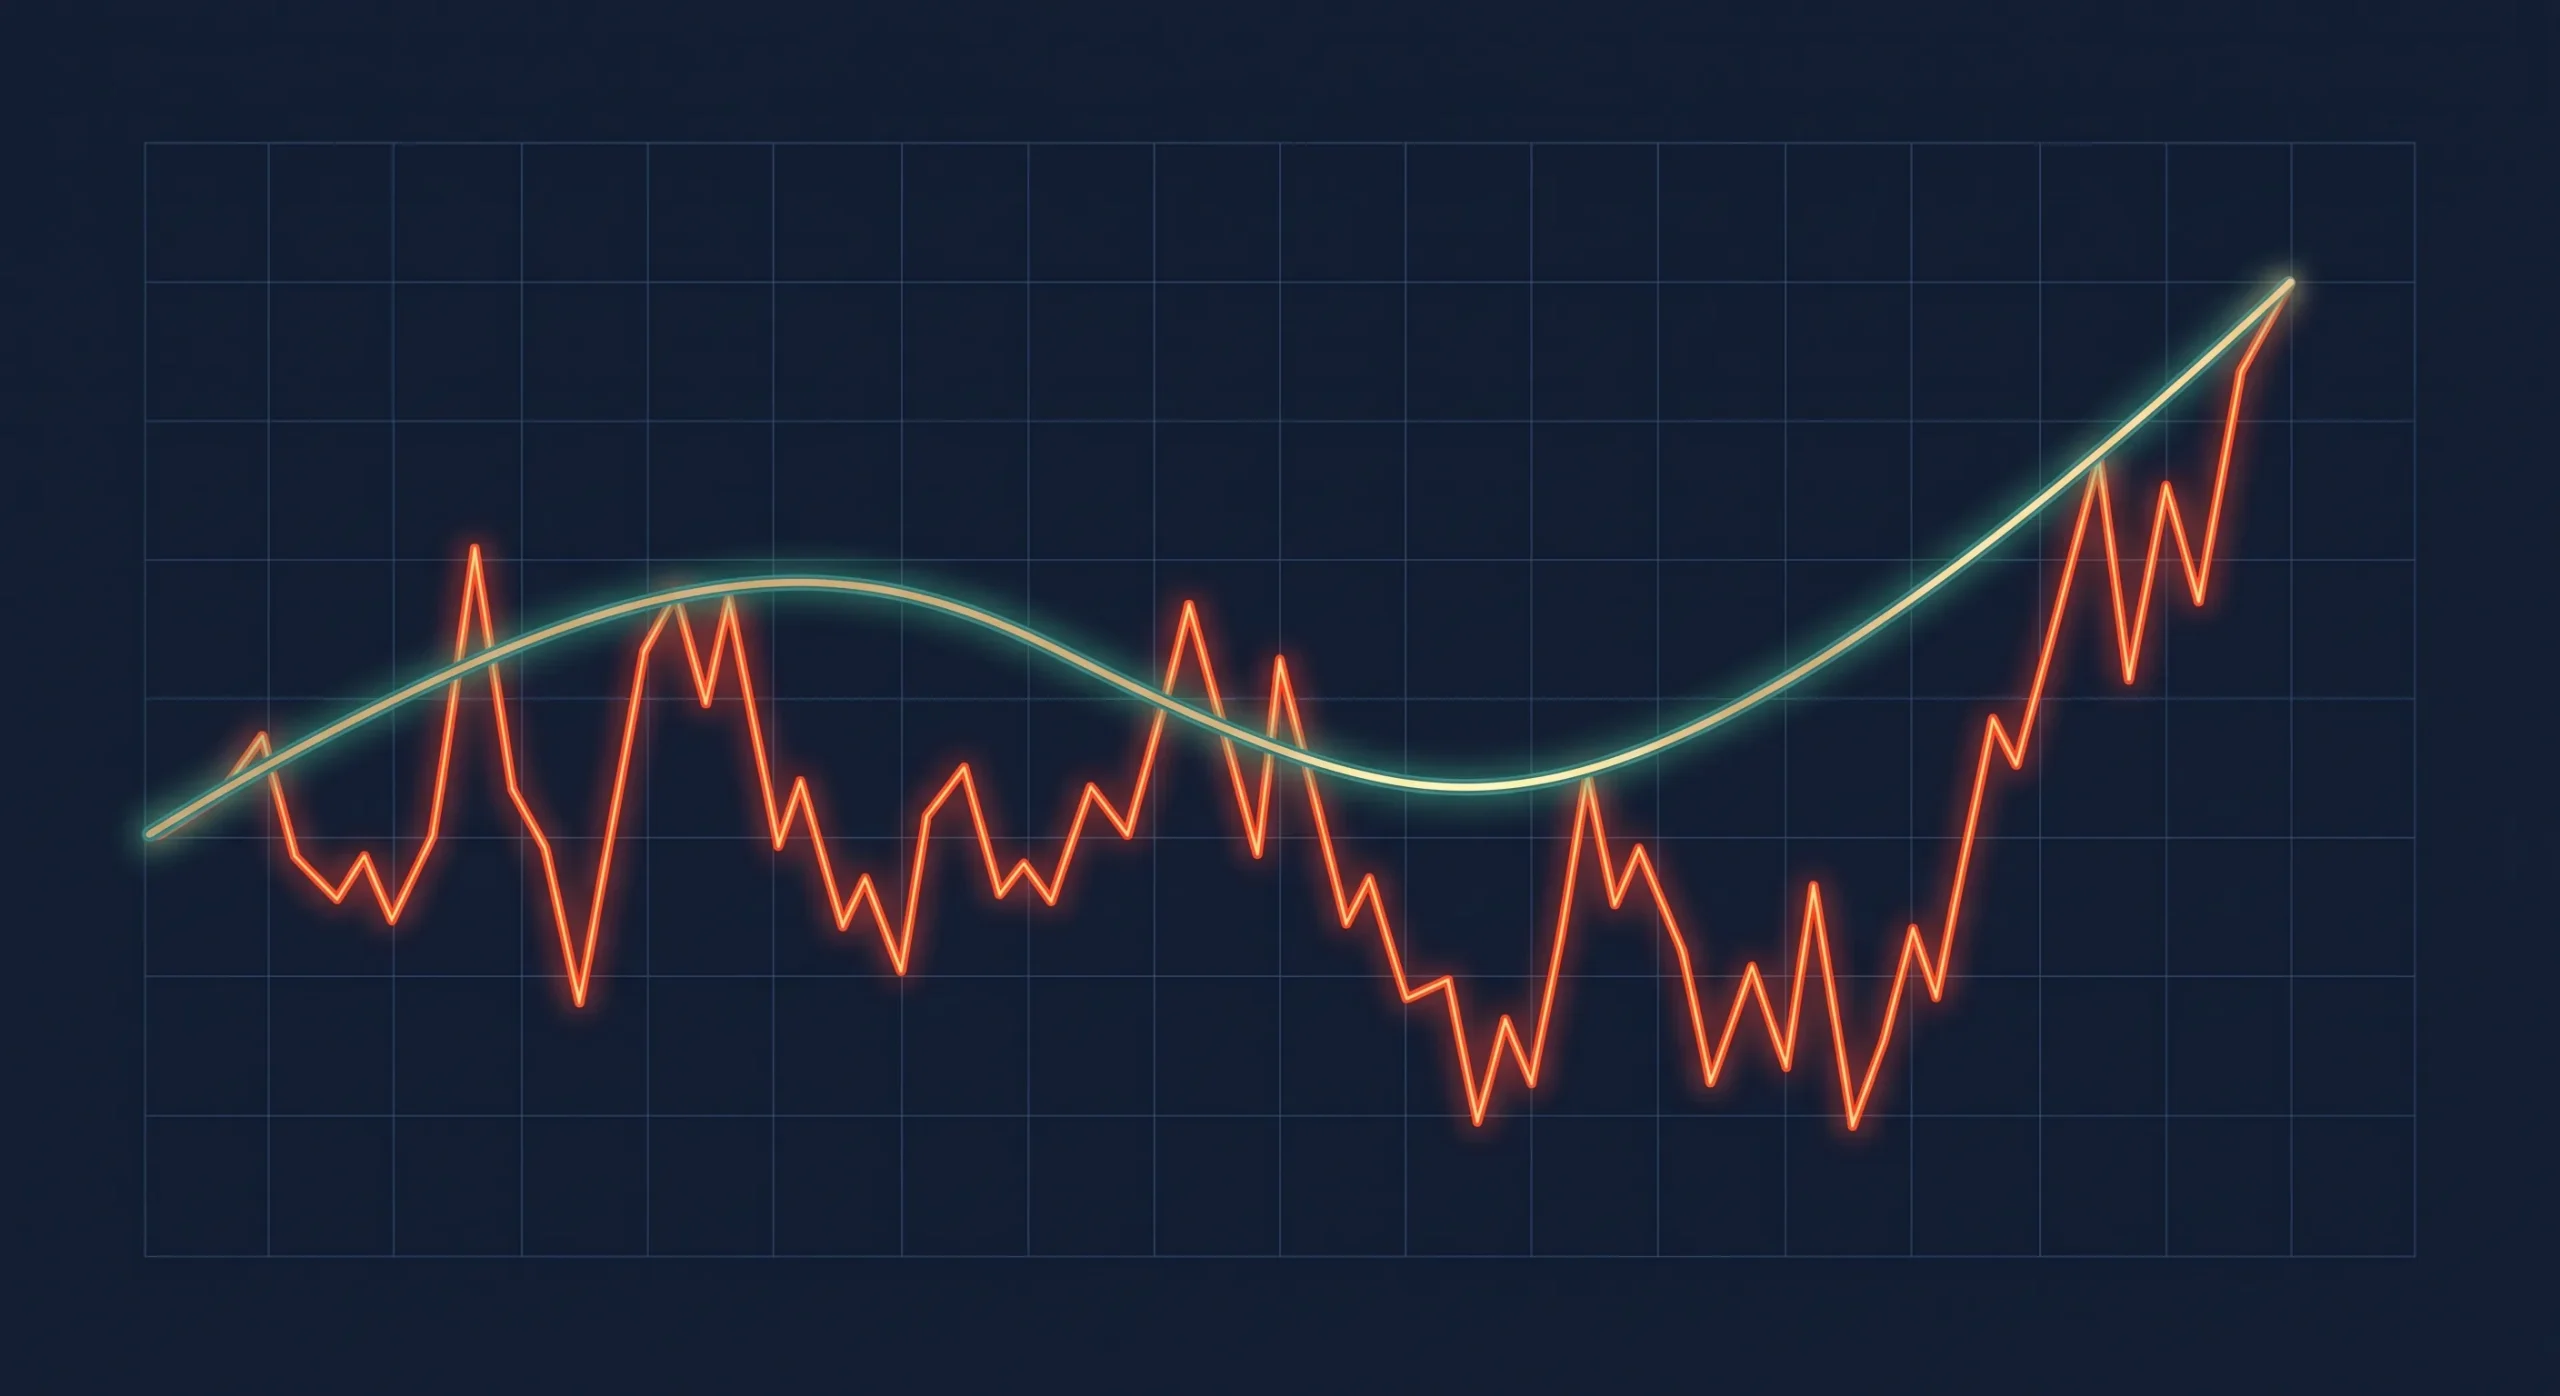
Your portfolio generated a 10% return last year. That’s good. Is it good? Maybe… or maybe not. You’re satisfied, which is already an important point, and you might even share this result with your loved ones. But wait a moment: what does this figure really mean?
This 10% return can hide two radically different realities. Perhaps you achieved this performance in a bull market where indices rose by 15%. Or perhaps you experienced emotional rollercoasters, with 30% drops followed by spectacular recoveries. In the first case, you would have underperformed the market. In the second, you would have paid a very high psychological price for this result.
True performance is not just a simple percentage. It is measured through the prism of risk-adjusted return: how much have you earned, and above all, what risk have you taken to achieve it? Understanding this notion means understanding whether your portfolio is growing in a healthy and sustainable way… or if it rests on a fragile balance. In other words, it is a subtle balance between the return obtained and the risk incurred.
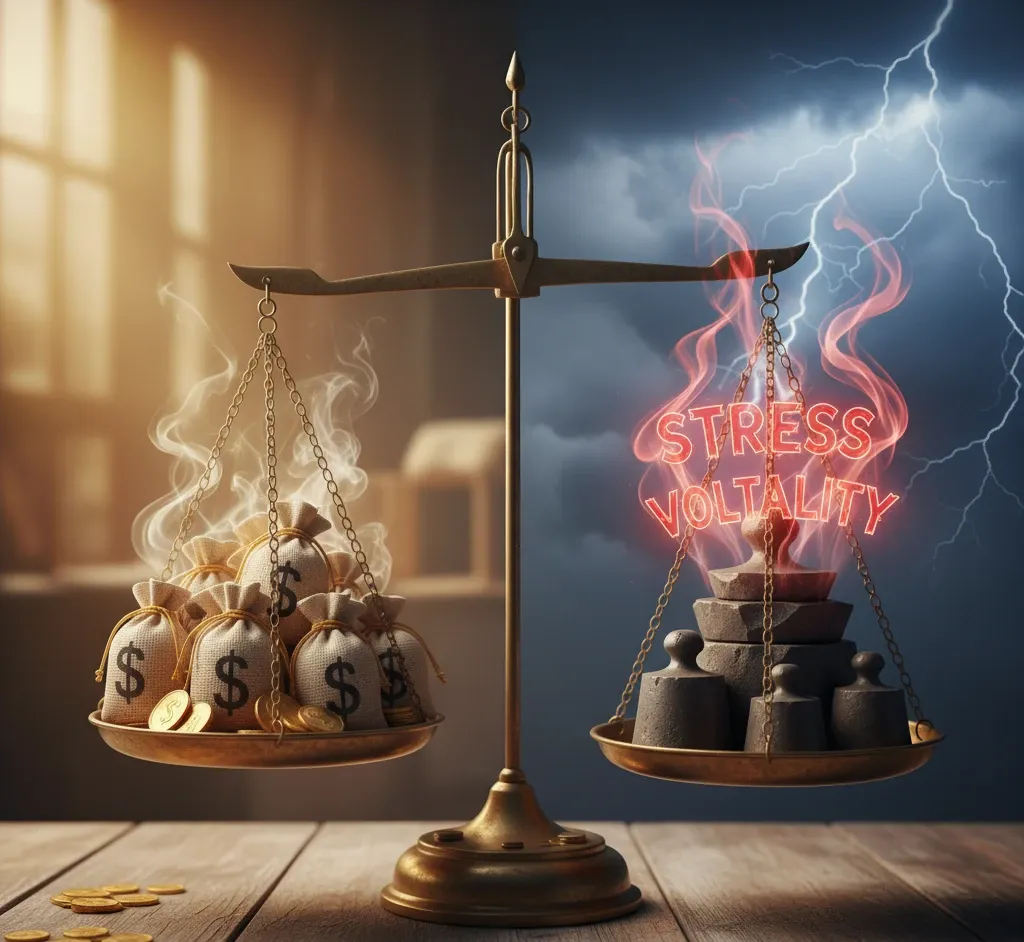
In this article, we will explore how to evaluate your portfolio in a more nuanced and realistic way, to help you make informed and serene decisions. We also invite you to discover how Investminder.com can simplify this analysis by focusing on the risk/return couple.
Return: measuring what you actually earn
Absolute return
Let’s start with the basics. Absolute return is calculated simply:
Return = (Final Value – Initial Value + Dividends – Fees) / Initial Value × 100
If you invested €10,000 which are now worth €11,500, with €200 in dividends received and €100 in fees, your return is: (11,500 – 10,000 + 200 – 100) / 10,000 = 16%.
But beware of the trap: this figure, taken in isolation, tells you almost nothing. A 15% return obtained by taking excessive risks can represent poor performance if the market generated 10% with much less volatility. Return alone completely ignores the dimension of the risk incurred and the turbulence experienced to achieve it (volatility).
Annualized return
When comparing investments over different periods, simple return becomes misleading. To compare two investments over different durations, we use annualized return, which normalizes the results on an annual basis:
Annualized Return = [(Final Value / Initial Value)^(1/number of years) – 1] × 100
Let’s take a concrete example: you invested €10,000 which are worth €15,000 after 4 years.
- Total return: 50%
- Annualized return: [(15,000 / 10,000)^(1/4) – 1] × 100 = 10.67% per year
Managing contributions and withdrawals
This is where things get complicated. If you add or withdraw money along the way, the simple return calculation becomes inaccurate. This is where Time-Weighted Return (TWR) comes in, which measures the true performance of your investment strategy regardless of the timing of your cash flows.
Conversely, Money-Weighted Return (MWR) reflects your personal experience by taking into account when you invested or withdrew funds. Both have their uses, but TWR is generally preferable for evaluating the pure quality of your strategy.
Real return: inflation, the silent thief
A final crucial adjustment: inflation. A 10% return seems excellent, but if inflation is 3%, your purchasing power has only increased by about 7%.
Real Return = Nominal Return – Inflation Rate
Drawdown: The indicator of real loss risk
If return measures gain, drawdown measures pain. It represents the maximum loss suffered by your portfolio between its highest point (a peak) and the subsequent trough. It is the indicator of the risk you truly feel.
A 50% drawdown means that if you had invested €1000 at the peak, that investment would have fallen to €500. It is this indicator, much more than volatility, that tests your nerves and can push you to sell at the worst time.
Let’s take striking examples:
- In 2008, the S&P 500 experienced a drawdown of -56.8%. If you had €100,000 at the peak, you would have ended up with €43,200.
- In 2022, the Nasdaq fell by more than -35%. Investors focused on tech saw a third of their capital evaporate.
A 50% drawdown means you will need a 100% gain to simply return to your starting point. This is the asymmetry of losses.
The psychological dimension
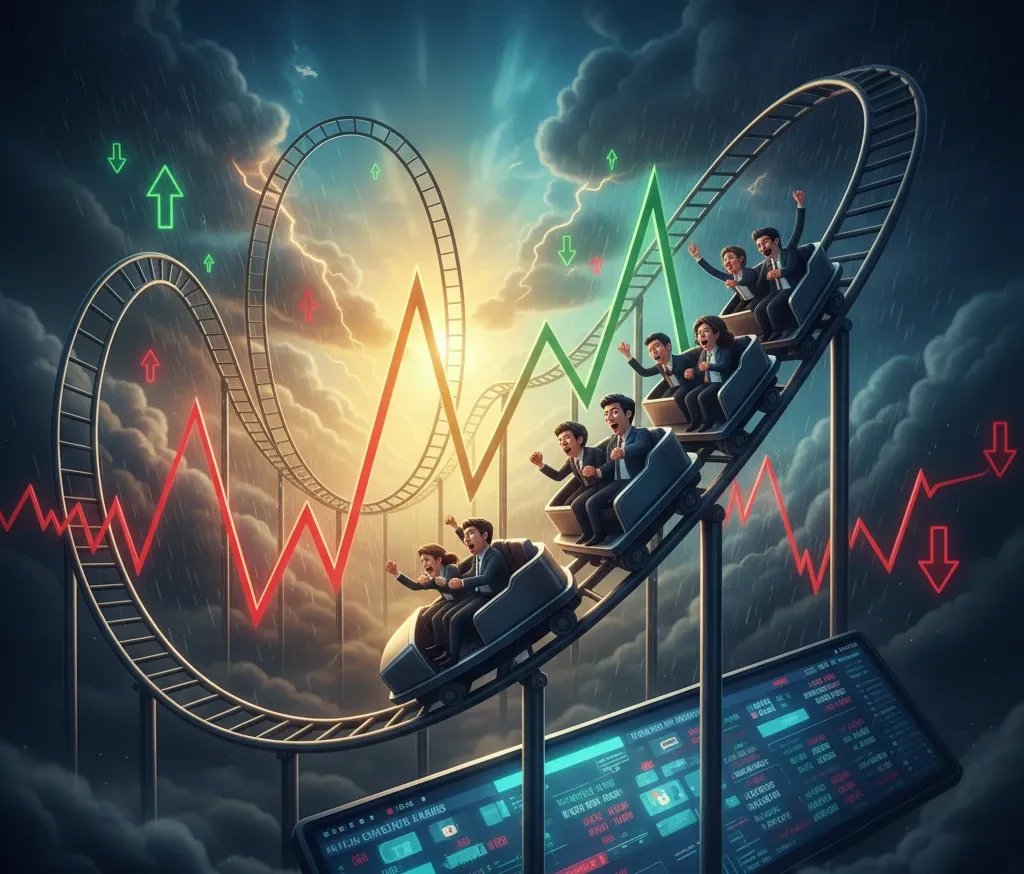
Drawdown is the indicator that makes you panic at night. It is what tests your conviction, your strategy, and your ability to stay the course. Many investors abandon their positions at the worst time, precisely at the bottom of the drawdown, thus crystallizing their losses.
The limits of Sharpe and Sortino ratios
In the world of institutional finance, two ratios dominate the evaluation of risk-adjusted performance: the Sharpe ratio and the Sortino ratio. But their complexity and assumptions limit their use for individual investors.
The Sharpe ratio
Sharpe Ratio = (Return – Risk-Free Rate) / Volatility
This ratio measures the excess return obtained per unit of risk (measured by volatility). The higher it is, the better the risk-adjusted performance.
The Sortino ratio
The Sortino ratio works on the same principle, but only considers downside volatility, ignoring positive fluctuations. The idea? Only losses constitute a real risk. In theory, it is more relevant. In practice, it requires detailed data and remains difficult to interpret.
The problem of the risk-free rate
These ratios seem elegant on paper, but they rely on a vague notion: the “risk-free rate”. Which risk-free rate to use? 10-year US Treasury bonds offer about 4% in 2025, but were close to 0% after the 2008 crisis. The “risk-free rate” varies by country, duration, period… and becomes very difficult to estimate for an individual investor.
Moreover, volatility is not always representative of real risk: a very volatile asset can follow a regular upward trend, while a less volatile asset can suffer sudden and devastating losses.
| Criterion | Sharpe/Sortino | Drawdown |
|---|---|---|
| Complexity | Requires a reference rate | Direct and measurable |
| Understanding | Abstract for the general public | Intuitive (maximum loss) |
| Relevance | Depends on assumptions | Reflects real experience |
| Calculation | Complex statistical data | Simple to calculate |
A simpler and more pragmatic approach: return vs drawdown
Faced with these complexities, a simpler and more effective approach emerges for the individual investor: comparing strategies along two fundamental axes.
- How much have I earned? (the return)
- How much have I risked losing? (the maximum drawdown)
This approach, adopted by Investminder, is clear, measurable, and understandable by all investors. It allows you to answer essential questions:
- Am I satisfied with my return given the stress endured?
- Could I have obtained a similar return with less risk?
- Am I willing to endure this level of drawdown again?
Concrete example
Imagine two portfolios over 5 years:
- Portfolio A: +12% annualized return, -10% maximum drawdown
- Portfolio B: +12% annualized return, -40% maximum drawdown
Which one do you really prefer? The return is identical, but the investment experience is radically different. Portfolio A allows you to sleep soundly, while Portfolio B will have given you sleepless nights and perhaps pushed you to sell at the worst time.
Comparing with relevant benchmarks
Choosing the right benchmark
Your benchmark should reflect your allocation:
- European equities: Euro Stoxx 50, CAC 40
- US equities: S&P 500, Nasdaq 100
- Global equities: MSCI World
- Bonds: bond indices according to duration and quality
- Mixed portfolio: combination of equity/bond indices
The common mistake is to compare yourself to the wrong index. If you invest in bonds, comparing yourself to the S&P 500 makes no sense.
Evaluating both benchmark return AND drawdown
The comparison must cover both dimensions:
- Is your return higher or lower than the benchmark?
- Is your drawdown more or less significant?
The ideal: outperform with less risk. But underperformance with a significantly reduced drawdown can also represent excellent management.
Example: Your portfolio makes +8% with -15% drawdown, while the S&P 500 makes +10% with -30% drawdown. You may have “lost” 2% in return, but you have halved the risk. For many investors, this is an excellent compromise.
Market context matters
It is crucial to distinguish between absolute and relative performance. In a bear market where indices fall by 20%, losing 10% represents excellent relative performance. Conversely, gaining 5% in a market that rises by 25% is disappointing.
Also accept that no strategy outperforms all the time. Market cycles alternately favor different investment styles. The goal is consistent long-term performance.
Frequency of evaluation
Avoiding over-monitoring
One of the most insidious traps of modern investing is over-monitoring. Behavioral studies show that checking your portfolio too frequently harms performance. You observe more negative movements (the market falls about 45% of the time), which increases anxiety and leads to emotional decisions.
Our recommendation
A balanced approach could be:
- Monthly monitoring: a quick glance to maintain basic vigilance
- Quarterly review: a more detailed analysis of performance and deviations from the plan
- In-depth annual review: a comprehensive examination including reassessment of your strategy, objectives, and risk tolerance

The impact of fees on performance
Hidden fees that erode returns
Fees are the silent enemy of performance. The main fees include:
- Brokerage fees: at each transaction
- Management fees: for active funds, often 1.5% to 2% per year
- Custody fees: with some brokers
- Exchange fees: for investments in foreign currencies
- Taxation: Flat-rate withholding tax (PFU) of 30% in France on capital gains and dividends
Calculating real net return
The only return that truly matters is real net return: net of fees AND net of inflation.
The cumulative effect over the long term
Over 30 years, with an initial capital of €100,000 and an annual gross return of 8%:
- With 0.2% fees: you get about €900,000
- With 2% fees: you get about €450,000
The difference? €450,000 gone in fees. That’s half of your assets that enriched intermediaries rather than you. Reducing your investment fees is one of the most powerful levers to improve your long-term performance.
Conclusion: Invest with the right compass
The performance of a portfolio is not measured by a simple return figure proudly announced at a dinner. It is judged by the balance of two inseparable dimensions: the gain obtained and the risk assumed to achieve it.
The pragmatic approach that stands out is that of the return/drawdown couple: how much have I earned, and what was my maximum loss along the way? These two simple and concrete indicators reflect your real investor experience and allow you to make informed decisions.
Investminder: your co-pilot for serene evaluation
At Investminder.com, we have chosen simplicity and clarity. Our platform allows you to analyze your portfolio through the prism of the risk/return couple, without the complications of theoretical ratios.
You can access in a few clicks: your real annualized return, your historical maximum drawdown, a visual comparison with relevant benchmarks, and the evolution of your performance over time.