
Practical Guide: The Relative Strength Index (RSI)
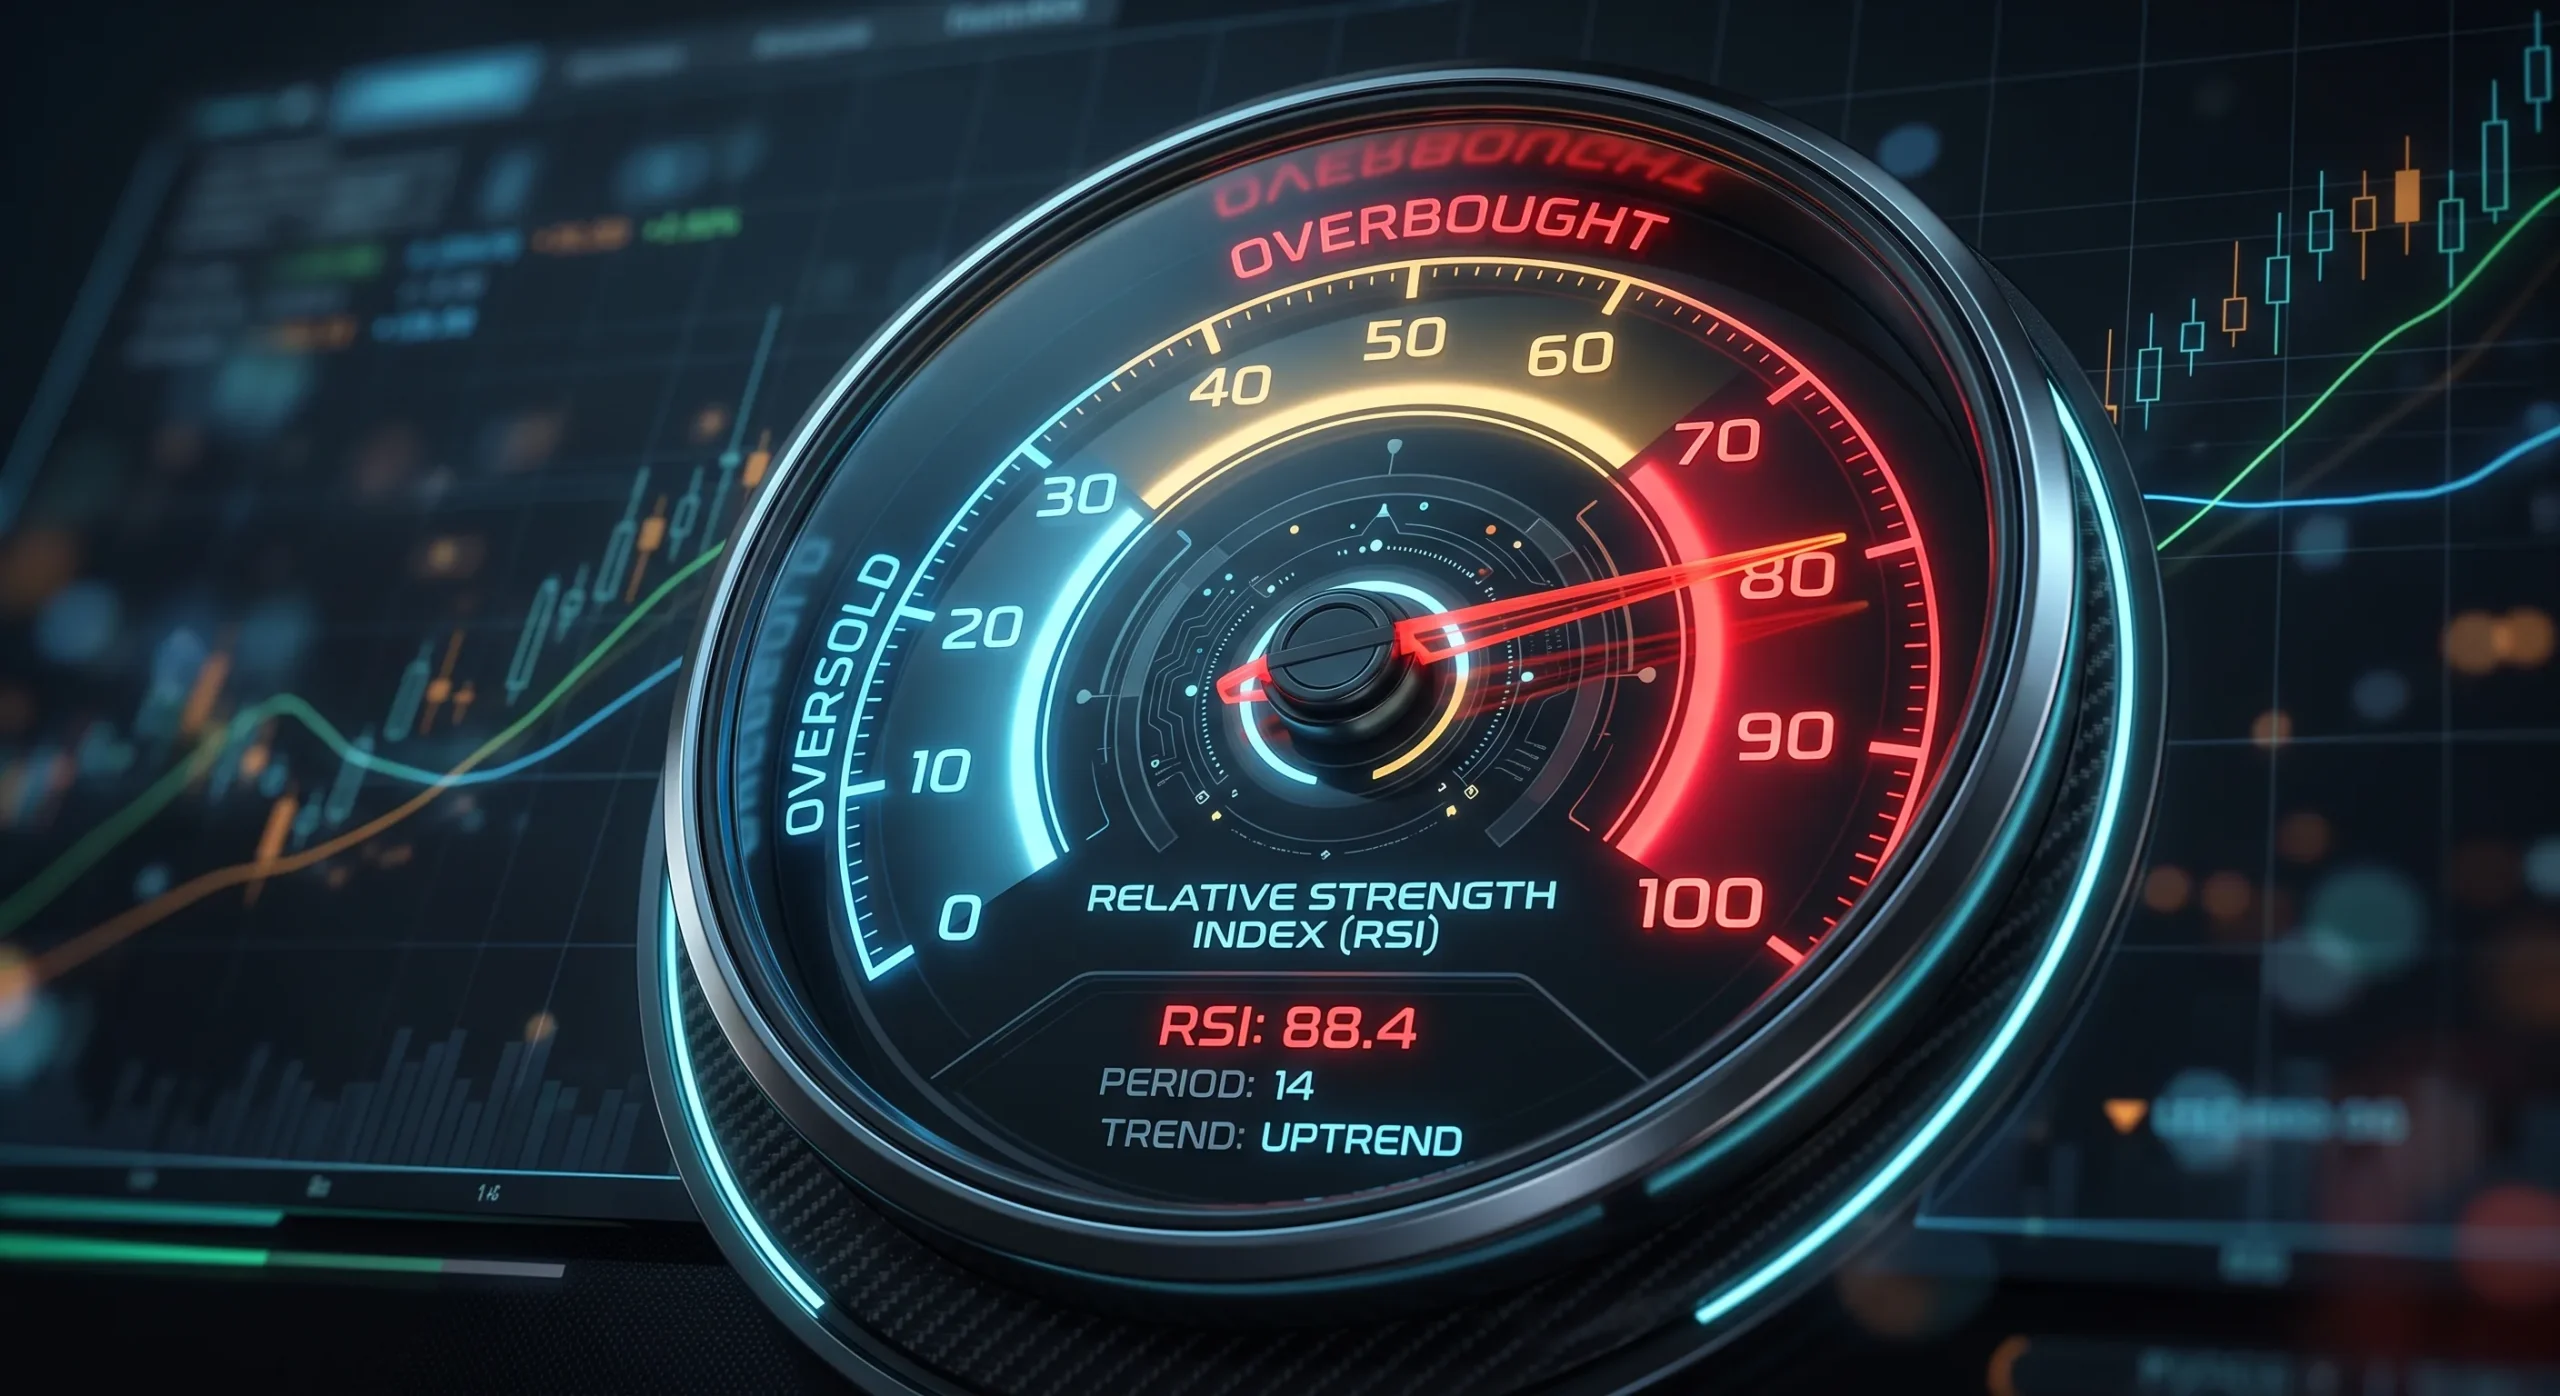
Relative Strength Index

Category: Momentum Oscillator RSI Overview Definition The RSI (Relative Strength Index) is an indicator that measures the momentum and speed of price movements. Imagine it as a speedometer for a stock or any other financial asset. It is represented by a curve that always oscillates between 0 and 100. What is it used for? The primary purpose of the RSI is … Read more
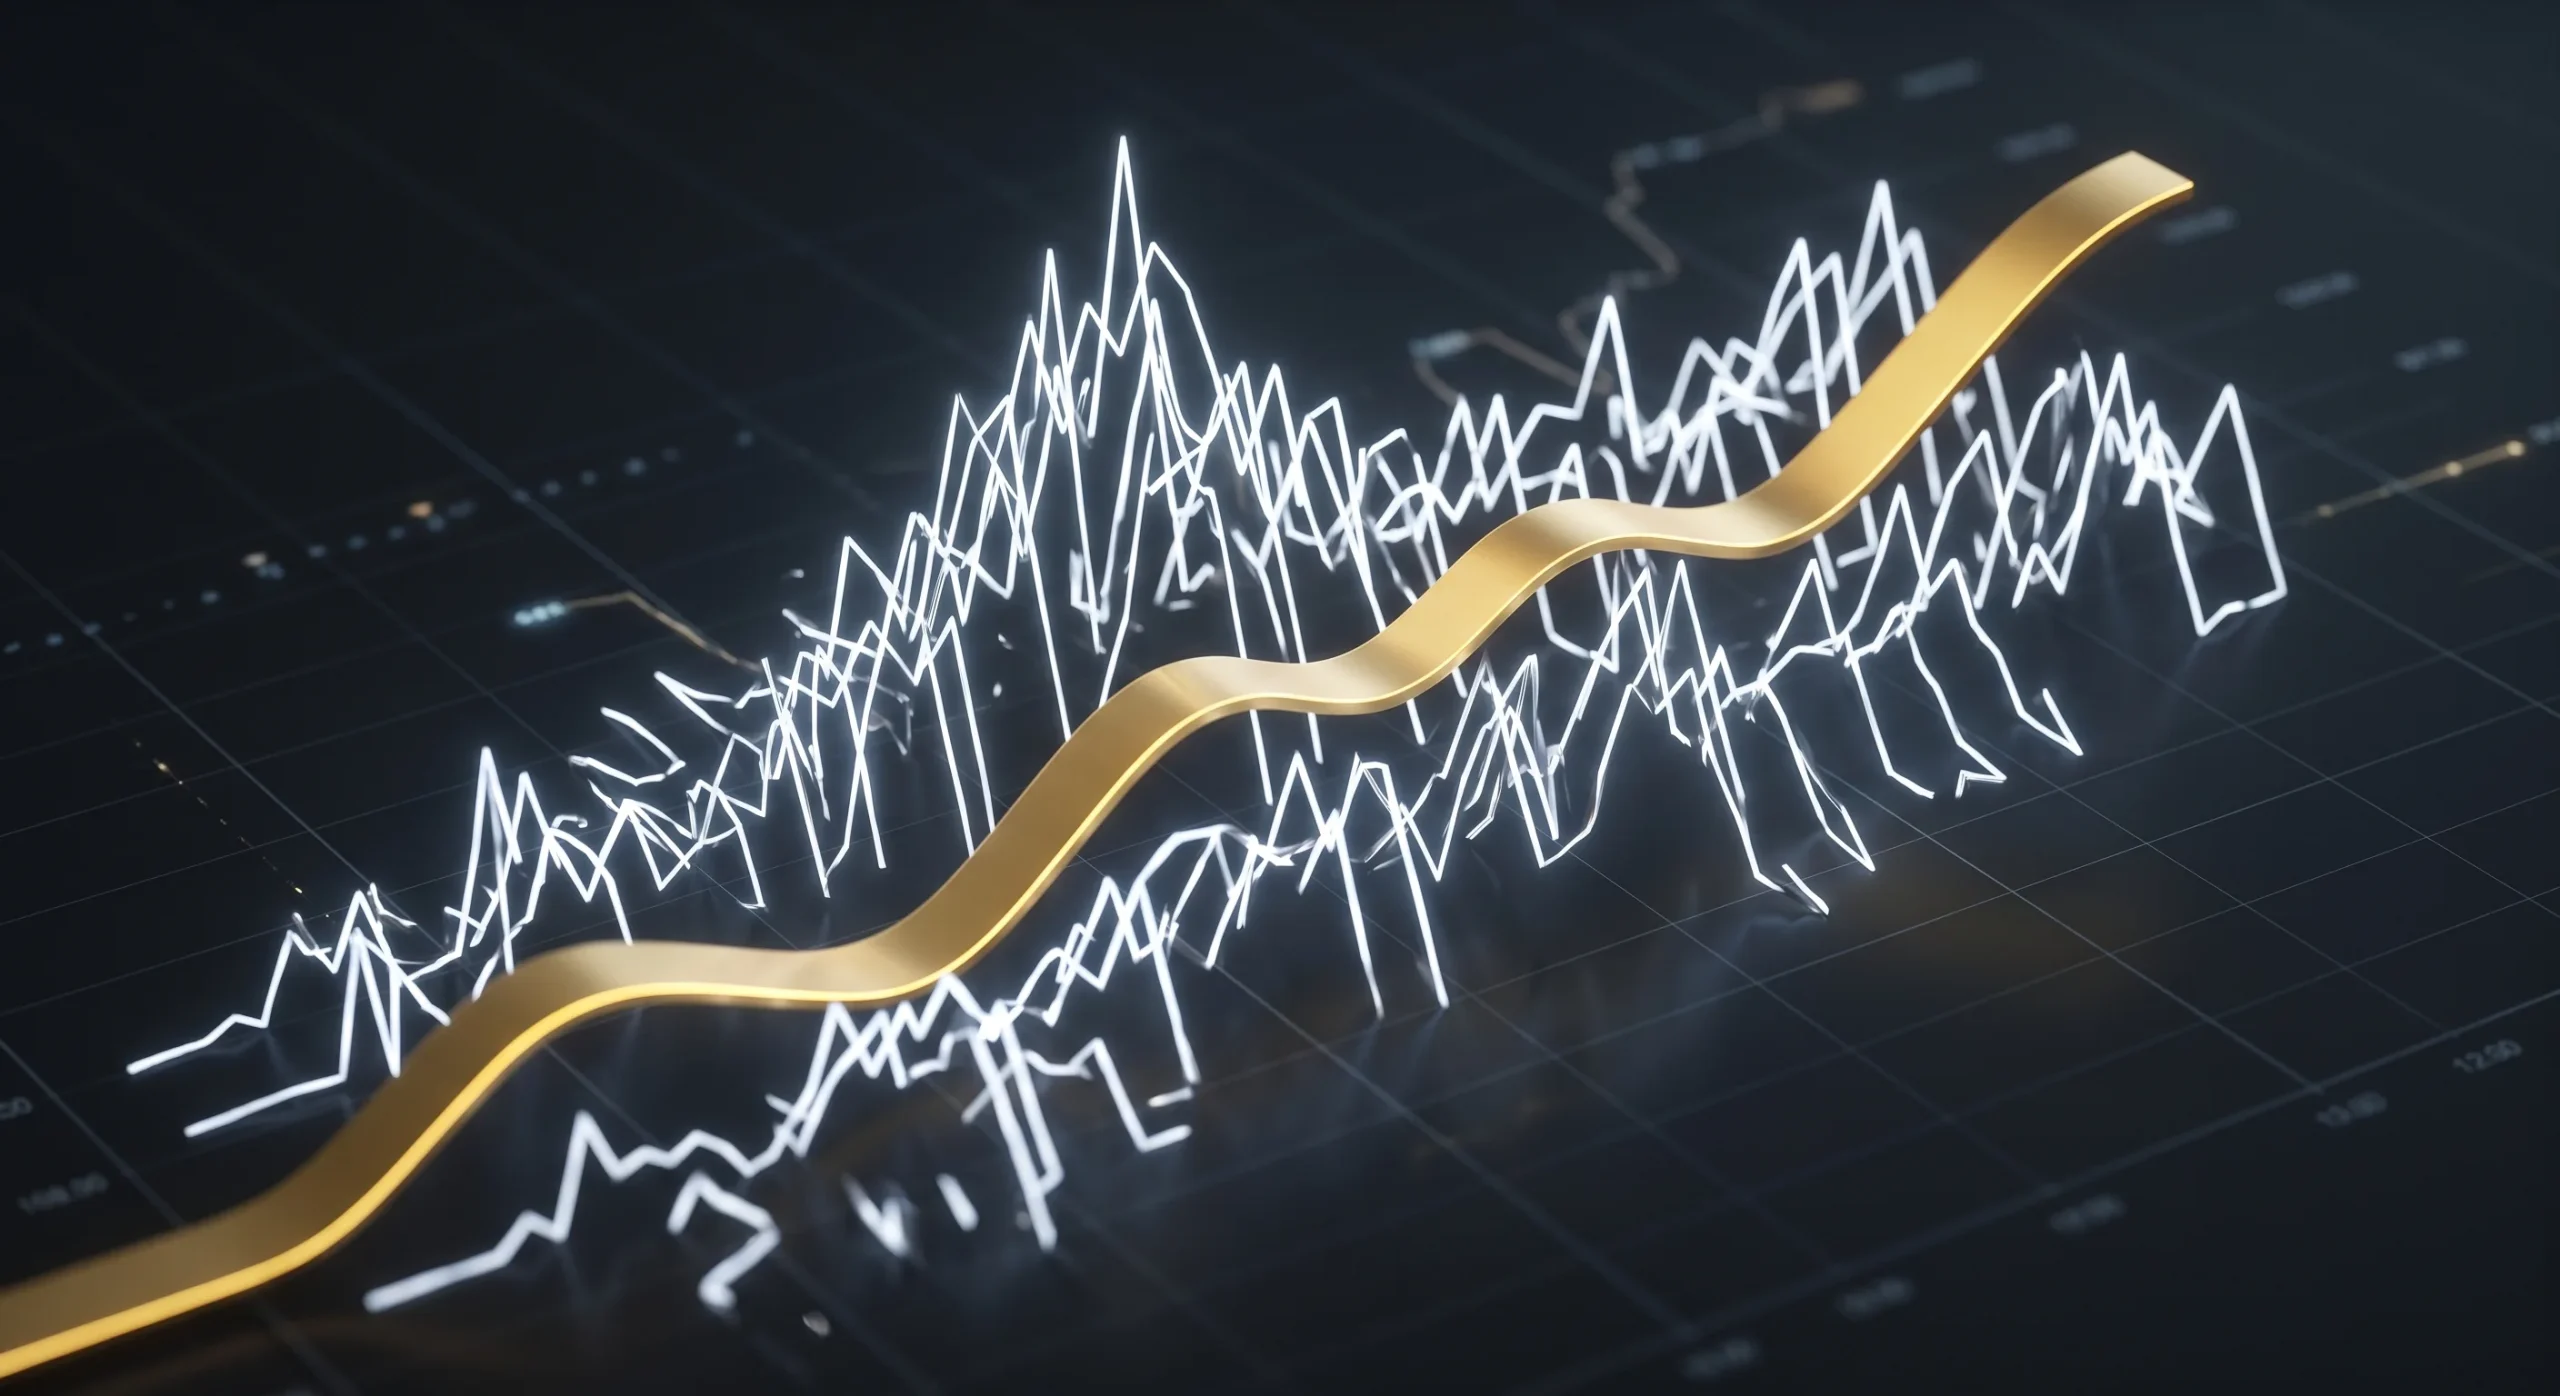
Practical Guide: Moving Averages (SMA & EMA)

Moving average: remove the noise but introduce a lag

Category: Trend Indicator (Trend Following) Introduction to Moving Averages Definition A Moving Average is a line plotted on the price chart. It calculates the average price of an asset over a past period. Its purpose is to filter out the “noise” (insignificant small daily variations) to reveal the actual direction of the trend. SMA or EMA? … Read more

Practical Guide: The MACD

Moving Average Convergence Divergence

Category: Trend & Momentum Indicator (Hybrid) Introduction to MACD Definition MACD (pronounced “Mac-Dee”) stands for Moving Average Convergence Divergence. Unlike the RSI which is bounded between 0 and 100, the MACD has no limits. It is designed to reveal changes in the strength, direction, and duration of a trend. The 3 Components of MACD To read … Read more

Practical Guide: Composite Momentum (1-3-6 & 3-6-12)

Momentum calculated over 1-3-6 months

Category: Asset Selection (Screening / Ranking) & Trend Tracking Introduction to Composite Momentum Definition Composite Momentum is a scoring method that measures an asset’s performance over several simultaneous periods. Instead of just looking at whether a stock went up yesterday or last month (which can be noise), we look at its “health” over the short, … Read more

Practical Guide: ATR (Average True Range)

Average True Range

Category: Volatility Indicator (Risk Management) Introduction to ATR Definition The ATR (Average True Range) does not concern itself with the direction of the price (up or down). It only focuses on the intensity of the movement. It measures the market’s “nervousness” or “heat.” Low ATR = The market is calm, the candles are small. High ATR … Read more